The observability bill is the one that surprises people twice. The first time is when it arrives and it's a third of the compute bill. The second is a year later, when it's more than the compute bill, because compute got cheaper per unit as you optimised and telemetry got more expensive per unit as you added tags.
We've written about keeping logs, traces and alerts cloud-neutral. That article series makes an architectural argument. This one makes the financial one, with numbers, for the three ways you can actually buy the backend: a full-service vendor, a hosted open-source stack, or running the open-source stack yourself.
The workload
To compare like with like, one workload, at the scale where the decision starts to matter:
| Signal | Volume | Notes |
|---|---|---|
| Logs | 100 GB / day | JSON, ~3 TB / month, 30-day retention |
| Traces | 50 GB / day after tail sampling | ~1.5 TB / month, 14-day retention |
| Metrics | 300,000 active time series | Scraped every 15 s, 13-month retention |
| Hosts | 40 | A mix of Kubernetes nodes and containers |
This is roughly a mid-sized product with a few hundred requests per second. Small teams are below it; most companies with a platform team are above it. The shape of the conclusions holds at both ends; the absolute numbers scale close to linearly.
Option 1: a full-service vendor
Datadog is the reference. List prices in 2026, roughly, and every large customer negotiates 20–40 % off, so treat these as the ceiling:
| Line | Unit price | Monthly |
|---|---|---|
| Log ingestion | ~$0.10 / GB | $300 |
| Log indexing, 30 days | ~$2.50 / million events (~2.5 KB each → ~40 M events / day) | $3,000 |
| APM hosts | ~$40 / host | $1,600 |
| Ingested spans beyond the included allocation | ~$0.10 / GB (after 150 GB / host included) | ~$0 at this volume |
| Infrastructure monitoring | ~$23 / host | $920 |
| Custom metrics beyond the included 100 / host | ~$5 / 100 metrics · 296,000 extra | ~$1,500 |
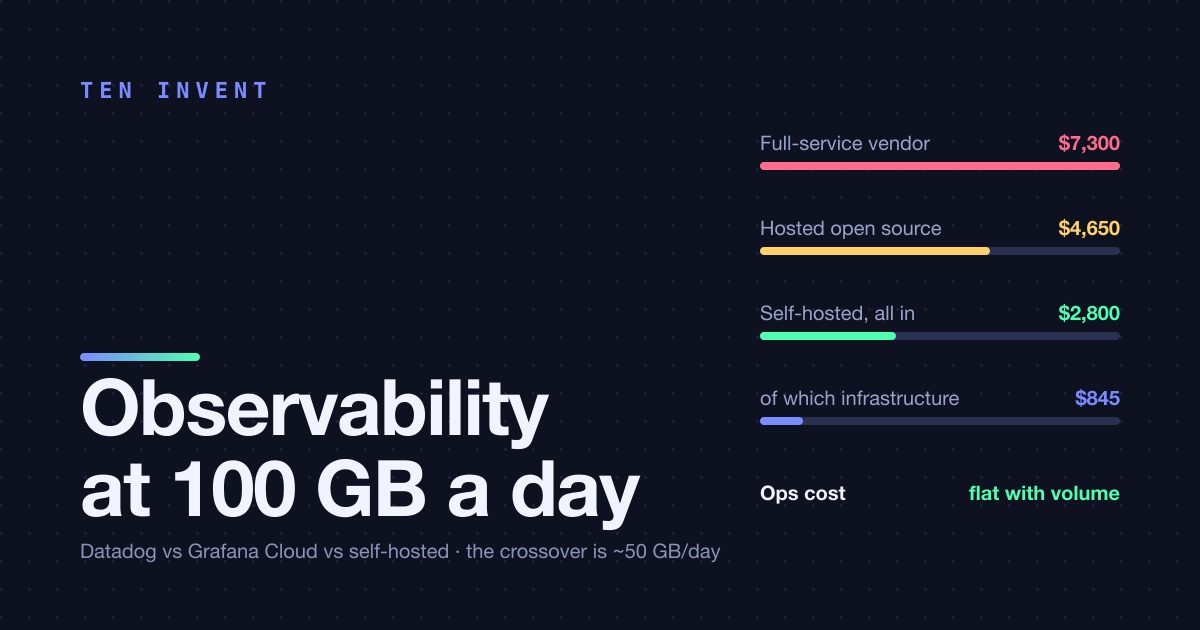
| Total | ~$7,300 |
The log indexing line dominates, and it's the one people don't expect: ingestion is cheap, being able to search is what costs. The custom metrics line is the second surprise, because "custom" means any metric that isn't from an agent integration, which is every application metric you emit.
What you get for it is real: one agent, one UI, every integration already built, security monitoring and RUM a checkbox away, and a support contract. For a team that has nobody to run infrastructure, that's the whole point.
Option 2: hosted open source
Grafana Cloud, hosting Loki, Tempo and Mimir with the same data model you'd run yourself. List prices, roughly:
| Line | Unit price | Monthly |
|---|---|---|
| Logs | ~$0.50 / GB ingested, 30 days included | $1,500 |
| Traces | ~$0.50 / GB ingested, 14 days included | $750 |
| Metrics | ~$8 / 1,000 series | $2,400 |
| Users, alerting, dashboards | included at this tier | $0 |
| Total | ~$4,650 |
Cheaper than the vendor by about a third, and the gap widens with log volume because there's no indexing multiplier. Metrics are the expensive signal here, which is the opposite of the vendor's profile. And there's an unstated cost that matters for us: our data leaves the client's cloud and lands in the provider's, which for one of our customers is a contractual problem and for another is a data-residency one.
Option 3: self-hosted
The same three components on our own compute, in the client's account, writing to object storage. The numbers below are for a deployment we actually run, at roughly this scale, on AWS list prices:
| Line | What | Monthly |
|---|---|---|
| Loki | 3 × m6i.large (write, read, backend), ~$70 each | $210 |
| Tempo | 2 × m6i.large | $140 |
| Mimir | 3 × r6i.large (memory-heavy), ~$125 each | $375 |
| Grafana + alerting | 1 × t3.medium | $30 |
| Object storage | ~1.2 TB compressed logs + traces + metrics blocks at $0.023 / GB | $30 |
| Load balancer, EBS for WAL | $60 | |
| Infrastructure total | ~$845 | |
| Operations | ~0.15 FTE: upgrades, capacity, on-call for the stack itself | ~$1,500–2,500 |
| Total | ~$2,300–3,300 |
The infrastructure is a rounding error. The honest line is operations. We estimate 0.15 of an engineer, which is roughly a day every two weeks: upgrading the three components, watching their own dashboards, adjusting retention and compaction, and being the person who gets paged when the observability stack is what's broken. That number is real, and it's the number vendors are right to point at. It's also a number that doesn't grow with volume: the tenth terabyte a day costs the same engineer-hours as the first.
The crossover, and why it's not where you think
At 10 GB a day, the vendor is about $1,200, hosted open source about $700, and self-hosted is still $845 in infrastructure plus the same operations cost, so $2,500. Self-hosting loses at small scale, clearly. The 0.15 FTE is a fixed cost, and at small volumes it's the whole bill.
At 100 GB a day, the table above: self-hosted wins by a factor of two to three, and the gap is mostly the log-indexing line.
At 1 TB a day, the vendor is somewhere past $50,000 a month after discounts, hosted open source around $30,000, and self-hosted is about $4,000 in infrastructure and perhaps 0.3 FTE, so under $10,000. At that scale the operations cost has stopped being the story.
The crossover is around 40–60 GB of logs a day, which is lower than most people guess. It's lower because self-hosted operations don't scale with volume and because the vendor's indexing charge does. If you're at 20 GB a day and growing 10 % a month, you'll cross it in about a year, and migrating observability backends is a project you'd rather do before you need to.
What the table doesn't show
Your data's location. Self-hosted keeps every log line in your account, in your region, under your KMS key. For two of our clients that's not a preference, it's a requirement, and it takes options 1 and 2 off the table before price is discussed.
Egress. If your workloads are on one cloud and the vendor's ingestion endpoint is elsewhere, every gigabyte pays egress on the way out. At 150 GB a day of logs and traces, that's another $400 a month, and it's in nobody's price list.
Lock-in, in both directions. The vendor's query language, dashboards and alert definitions don't export. The open-source stack's do, whether hosted or self-hosted: a Grafana dashboard JSON and a PromQL alert rule move between Grafana Cloud and your own Grafana unchanged. That's the strongest argument for option 2 over option 1 even when the prices are close: it keeps option 3 open.
The 0.15 FTE is optimistic if nobody wants the job. We have people who like running Loki. If your team doesn't, the operations cost isn't 0.15 FTE, it's a stack that's six versions behind and an outage nobody understands. Be honest about that before choosing option 3.
What we recommend
- Under about 30 GB a day, or no one to own it: hosted open source. Cheaper than the vendor, keeps the data model portable, no operations.
- Over about 50 GB a day, with someone who wants to run it: self-hosted, in the client's cloud, on object storage. Budget the engineer-hours explicitly and put them on the same table as the licence you didn't buy.
- Regulated data or contractual residency: self-hosted, regardless of volume.
- The full-service vendor: when you'd pay the premium for the integrations and the support, and when you're small enough that the premium is smaller than a person. That's a real segment, and it's not us.
The numbers move every year; the shape doesn't. Indexing and per-host pricing grow linearly with your product. An engineer running three open-source binaries on object storage doesn't. Wherever those lines cross for you, that's your decision point, and it's probably closer than you think.
Want the spreadsheet with your own volumes in it? We'll fill it in with you.