Every cloud sells you alarms. CloudWatch Alarms, Azure Monitor alert rules, Cloud Monitoring alerting policies: each one is preconfigured, each one is a few clicks, and each one is defined in a format that only its own cloud understands. If you run in more than one, you end up with three alerting systems, three on-call routings, three definitions of "the API is unhealthy", and, sooner or later, three different thresholds for the same thing because someone tuned one and forgot the others.
We've argued that logs and traces should be emitted by the application and stored somewhere the cloud doesn't own. Alerts are the third piece, and they're the one that matters at 02:40, because an alert is the thing that decides whether you're awake. This is how we define them once, from metrics the application emits, so that "error rate above 1 %" means the same thing on EKS, GKE and AKS, and moving a service between them doesn't change what pages you.
Alert on what the user sees, not on what the cloud sees
The cloud's native alarms are about the cloud's resources: CPU on an instance, 5xx count on a load balancer, throttles on a table. They're useful, and they're the wrong thing to page on, because a user doesn't experience CPU. A user experiences a slow or failed request. So the alerts that page are on three numbers per service, measured from the application's own point of view:
- Rate: requests per second, so a drop to zero is visible.
- Errors: fraction of requests that failed.
- Duration: latency at the 95th or 99th percentile.
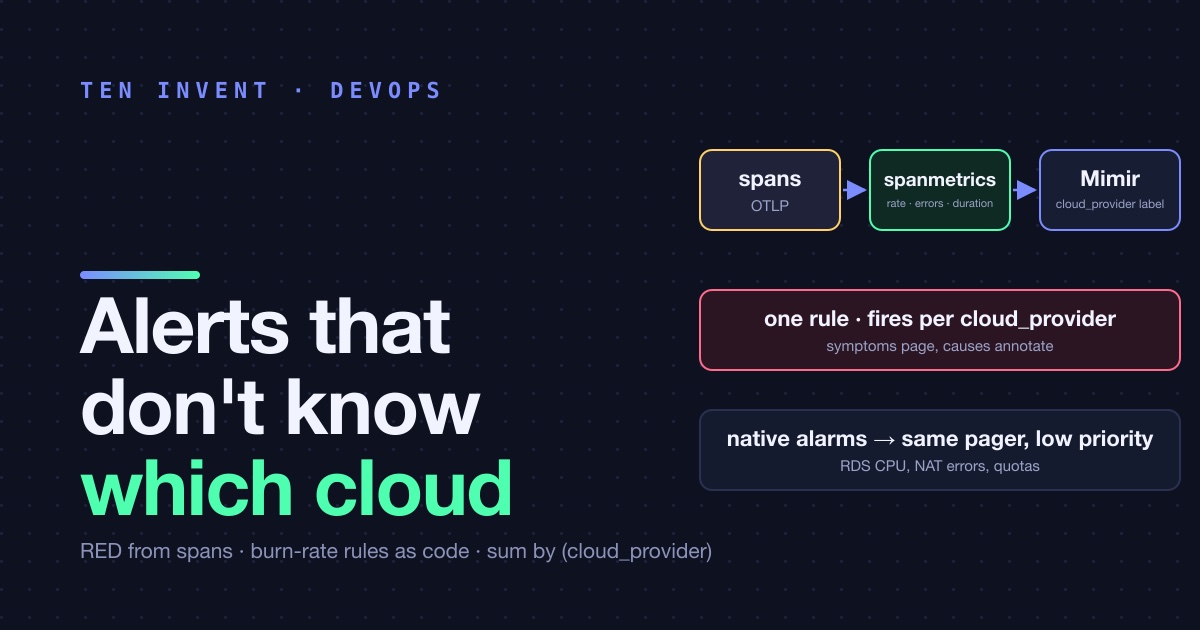
These come from the same OpenTelemetry pipeline that carries the traces. The collector's spanmetrics connector turns every server span into a histogram of durations and a counter of calls, labelled with service.name, the HTTP route, the status code and, because resourcedetection ran first, cloud.provider. No new instrumentation in the app. The spans you already emit become the metrics you alert on.
connectors:
  spanmetrics:
    histogram:
      explicit: { buckets: [50ms, 100ms, 250ms, 500ms, 1s, 2s, 5s] }
    dimensions:
      - name: http.route
      - name: http.response.status_code
    exemplars: { enabled: true }
    resource_metrics_key_attributes: [service.name, cloud.provider, cloud.region]

service:
  pipelines:
    traces:  { receivers: [otlp], processors: [resourcedetection, batch], exporters: [otlphttp/tempo, spanmetrics] }
    metrics: { receivers: [spanmetrics, otlp], processors: [batch], exporters: [prometheusremotewrite/mimir] }
The metrics go to Mimir (or plain Prometheus, or VictoriaMetrics; the architecture doesn't care). Exemplars are on, so a point on the latency graph links to a real trace that produced it.
The rules, written once
Grafana alert rules live in a YAML file in the repository and are provisioned on every deploy, the same way the dashboards are. One rule per SLO, not one per service per cloud. The query does the fan-out:
# alerting/rules.yaml
groups:
  - name: api-slo
    interval: 1m
    rules:
      - alert: ApiErrorBudgetBurn
        for: 2m
        labels: { severity: page, team: platform }
        annotations:
          summary: 'api error budget burning {{ $labels.cloud_provider }} · {{ $value | humanizePercentage }}'
          runbook: https://runbooks.internal/api-errors
        expr: |
          (
            sum by (cloud_provider) (rate(calls_total{service_name="api", http_response_status_code=~"5.."}[5m]))
            /
            sum by (cloud_provider) (rate(calls_total{service_name="api"}[5m]))
          ) > (14.4 * 0.001)
          and
          (
            sum by (cloud_provider) (rate(calls_total{service_name="api", http_response_status_code=~"5.."}[1h]))
            /
            sum by (cloud_provider) (rate(calls_total{service_name="api"}[1h]))
          ) > (14.4 * 0.001)
That's a multi-window burn-rate alert for a 99.9 % availability SLO: page when the error rate over the last five minutes and the last hour both exceed 14.4 times the error budget, which corresponds to burning the whole 30-day budget in about two days. The sum by (cloud_provider) is the entire multi-cloud story. One rule, one expression, and it fires separately for aws, gcp and azure, with the cloud in the alert title, if only one of them is on fire. Moving the API from EKS to GKE changes which label value fires. It doesn't change the rule.
A second rule with a longer window (6 hours and 3 days, threshold 1×) catches slow burns as a ticket rather than a page. Latency gets the same treatment on histogram_quantile(0.99, sum by (le, cloud_provider) (rate(duration_bucket{...}[5m]))).
What stays native, and how it joins
The cloud's own alarms don't go away; they change job. RDS CPU, Aurora ACU utilisation, NAT gateway error port allocation, DynamoDB throttles, service quota limits: these are properties of infrastructure the cloud owns, and the cloud's monitoring sees them first and best. We keep those alarms native, defined in the same CDK that defines the resource, and route them to the same pager as low priority. They inform; they don't wake anyone. If a NAT starts dropping packets, the API error rate alert pages within two minutes anyway, and the NAT alarm is sitting there in the incident channel explaining why.
That inversion is the whole point. Symptoms page. Causes annotate. The symptom alerts are cloud-neutral because the application emitted the data; the cause alerts are cloud-specific because the cloud emitted the data. Neither pretends to be the other.
Three things that took us longer than they should have
Cardinality. spanmetrics with http.route as a dimension is fine. With http.target (the raw path, including IDs) it generates a time series per order and Mimir falls over. Use the route template, never the path.
Silence during deploys. A rolling deploy produces a burst of connection resets for a few seconds. The for: 2m on the page rule absorbs it. Without it, every deploy paged someone for the first week.
The pager needs to be one thing. We had CloudWatch going to one on-call tool and Grafana going to another, because they'd been set up at different times. Two rotations, two apps on the phone, and one night where the person on call for one wasn't on call for the other. Everything now routes through Grafana's contact points to one rotation. The native alarms get there via an SNS topic → webhook, which took an hour to set up and should have been day one.
The short version
Alert on the three numbers the user feels, derived from spans you already emit, stored in a metrics backend you own, evaluated by rules you keep in git with a sum by (cloud_provider) in them. Keep the cloud's alarms for the cloud's things, at low priority, into the same pager. When a service moves clouds, one label value changes and nobody edits an alert.
Want the rules file for your own services, tuned to real SLOs rather than round numbers? Talk to us.