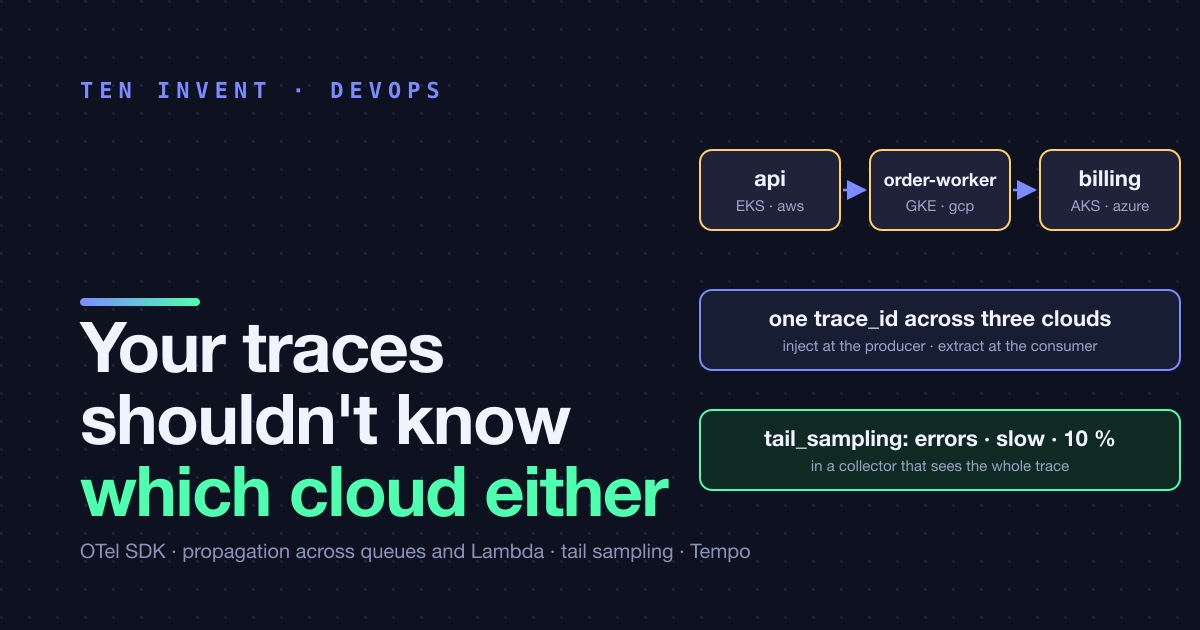
We made the case that application logs shouldn't be owned by the cloud: the app emits, an agent stamps the cloud onto it, a neutral backend stores it. Logs were the easy half. A log line is self-contained. A trace isn't: it's a tree of spans produced by five services on three clouds, stitched together by an ID that has to survive every hop in between, including a queue and a function that doesn't speak HTTP. If the ID doesn't make it across, you don't have a trace, you have five unrelated spans and the same 02:40 correlation-by-eye we were trying to get rid of.
This is the same architecture applied to tracing, with the parts that are different: propagation, sampling, and what the query looks like when it works.
The three layers, again
The application uses the OpenTelemetry SDK and nothing vendor-specific. In Node that's @opentelemetry/sdk-node with auto-instrumentation for HTTP, the database driver, the AWS SDK and the queue client. It exports spans over OTLP to localhost:4317. It has no idea whether the collector on the other end forwards to Tempo, X-Ray or a file.
// tracing.ts, loaded with --require before the app
import { NodeSDK } from '@opentelemetry/sdk-node';
import { getNodeAutoInstrumentations } from '@opentelemetry/auto-instrumentations-node';
import { OTLPTraceExporter } from '@opentelemetry/exporter-trace-otlp-grpc';
import { Resource } from '@opentelemetry/resources';

new NodeSDK({
  resource: new Resource({ 'service.name': process.env.OTEL_SERVICE_NAME }),
  traceExporter: new OTLPTraceExporter({ url: 'http://localhost:4317' }),
  instrumentations: [getNodeAutoInstrumentations()],
}).start();
service.name is the only attribute the app sets. Everything about where it runs is added later.
The collector is the same DaemonSet config as for logs with a traces pipeline added. The resourcedetection processor stamps cloud.provider, cloud.region and k8s.cluster.name onto every span, exactly as it did on every log line, from the same metadata endpoint, with zero branching between EKS, GKE and AKS.
The backend is Grafana Tempo: OTLP in, TraceQL out, object storage underneath, no index to size. Tempo and Loki sit next to each other in the same Grafana, which is what makes "jump from this log line to its trace" a click rather than a copy-paste.
The hard part: the ID has to cross the gaps
Within one service, the SDK handles context automatically. Between services over HTTP, the W3C traceparent header is injected by the client instrumentation and extracted by the server instrumentation, and it just works. The gaps are everything that isn't a synchronous HTTP call.
Queues. SQS, Pub/Sub and Service Bus don't carry HTTP headers. The producer has to put the context somewhere the consumer will find it, and the consumer has to pull it out and start its span as a child (or, more honestly, a link, since the consumer runs later and possibly in a batch). The AWS SDK instrumentation does this for SQS if you use it, via message attributes; for other clients you write ten lines:
// producer
const carrier: Record<string, string> = {};
propagation.inject(context.active(), carrier);
await queue.send({ body, attributes: { traceparent: carrier.traceparent } });

// consumer
const parent = propagation.extract(context.active(), { traceparent: msg.attributes.traceparent });
const span = tracer.startSpan('process order', { links: [{ context: trace.getSpanContext(parent)! }] }, parent);
Lambda. The function doesn't have a long-lived process for the SDK to live in, so the OpenTelemetry Lambda layer wraps the handler, extracts context from the event (HTTP headers for API Gateway, message attributes for SQS, or a traceparent field we put in the payload ourselves for direct invocations), and flushes spans before the function freezes. The flush is the detail that matters: without it, the last span of every invocation is lost.
Cross-cloud HTTP. Nothing special. traceparent is a header like any other and the load balancers on all three clouds pass it through. The only thing to check is that your API gateway or WAF doesn't strip unknown headers; one of ours did, for a week, and every trace ended at the edge.
Sampling is where egress lives
Traces are bigger than logs per request: a single order flow produces forty spans with attributes. At scale, shipping all of them across cloud boundaries would cost more than the logs did. The answer is in the collector, and it has to be tail sampling, not head sampling: you can't decide at the start of a request whether it's going to be interesting.
processors:
  tail_sampling:
    decision_wait: 10s
    policies:
      - { name: errors,  type: status_code, status_code: { status_codes: [ERROR] } }
      - { name: slow,    type: latency, latency: { threshold_ms: 2000 } }
      - { name: baseline, type: probabilistic, probabilistic: { sampling_percentage: 10 } }
Keep every trace with an error, every trace slower than two seconds, and one in ten of the rest. That cut our trace volume by about 85 % and, in six months, we've never wanted a trace that had been dropped: the interesting ones are, by construction, the ones that are kept.
There's a catch specific to multi-cloud. Tail sampling needs all spans of a trace to arrive at the same collector instance to make a decision, and our spans are produced on three clusters. The fix is a two-tier collector: the per-node DaemonSet does resource detection and batching only, and forwards to a small central collector deployment (per cloud, or one shared) that does the tail sampling with a load balancer that routes by trace ID. Ten more lines of config, and a component that exists purely because the trace crosses a boundary.
What the query looks like
The trace for the 02:40 incident, in TraceQL:
{ trace:id = "4bf92f3577b34da6a3ce929d0e0e4736" }
Every failing order flow that touched the Azure cluster in the last hour:
{ resource.service.name = "billing" && resource.cloud.provider = "azure" && status = error }
Orders slower than two seconds where the slow span was on GCP, which is the query that finds "the worker is slow, not the API":
{ resource.service.name = "api" && duration > 2s } >> { resource.cloud.provider = "gcp" && duration > 1500ms }
And from any log line in Loki with a trace_id, one click opens the trace in Tempo, because both are in the same Grafana and both got the same ID from the same SDK.
What stays native
X-Ray, Cloud Trace and Application Insights are fine products and they're each locked to one cloud. We don't use them for application traces for the same reason we don't use CloudWatch for application logs. Where they earn their keep is inside managed services we don't instrument ourselves: an AWS Step Functions execution or an API Gateway integration produces X-Ray segments for free, and they're useful for debugging that service. They don't need to join the application trace, and forcing them to is more work than it's worth.
The OTel SDK can propagate X-Ray's header format alongside W3C's if you need the two worlds to meet at a boundary. We turned it on once, for an API Gateway that insisted, and turned it off when the gateway moved.
The short version
Same collector config, one more pipeline. Same resource attributes, one more backend. The new work is at the gaps: inject on the producer, extract on the consumer, flush before a function freezes, sample at the tail in a collector that sees the whole trace. Once that's done, "why is this order slow" is a query that returns the answer with the cloud attached as a label, and moving a service between clouds changes the value of that label and nothing else.
If your traces stop at a queue or at a cloud boundary, we've stitched that gap before.