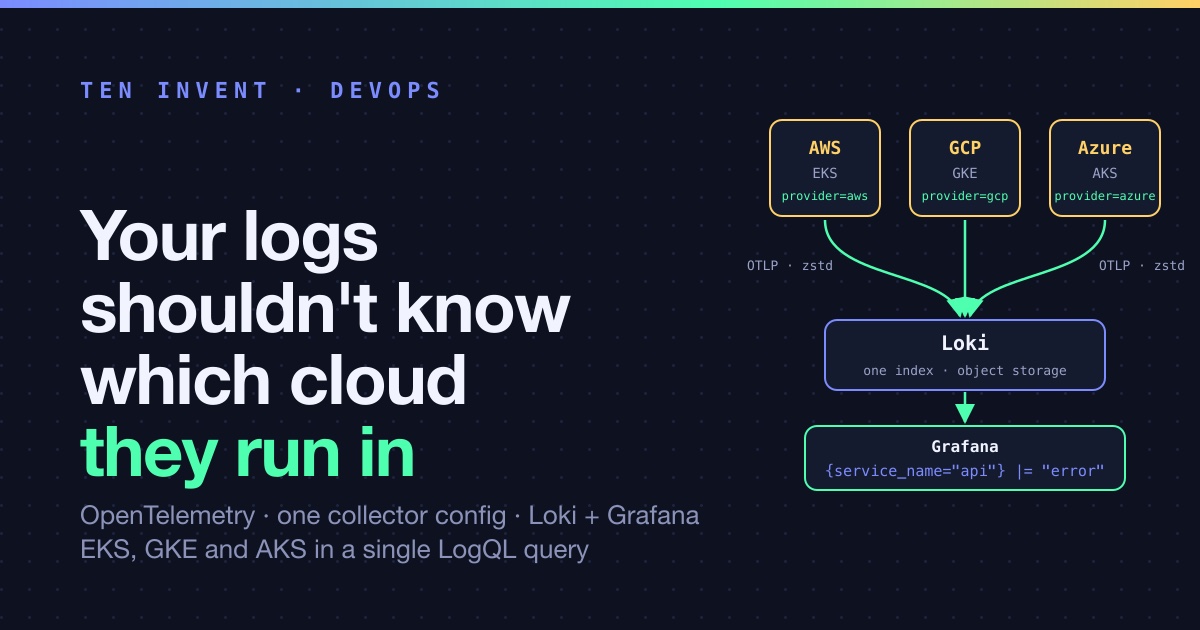
It's 02:40 and the order pipeline is dropping events. The API runs on EKS. The worker that enriches orders moved to GKE last quarter because the ML team lives there. The legacy billing service is still on AKS. You have three browser tabs open: CloudWatch Logs Insights, Cloud Logging with its own query language, and Azure Monitor with KQL. Three syntaxes. Three ways of spelling "the last fifteen minutes". CloudWatch shows timestamps in UTC, the Azure portal in your local time, Google in whatever the browser says. You correlate by eye, copying a request ID from one tab into the search box of the next, and you get it wrong twice before you get it right.
Nobody planned this. Each team took the logging its cloud offered, because it was there and it was preconfigured, and each decision was locally correct. The incident is the bill for those decisions arriving all at once.
The instinct is to fix it with tooling: buy something that queries all three, write a script that pulls from three APIs. That treats the symptom. The problem is architectural: you let the cloud own your logs. The application wrote to stdout, the platform picked it up, and from that moment the format, the query language, the retention and the price were decided by the vendor. Logs are an output of your application. Where they end up should be your decision, made once, and it should survive the next infrastructure change.
How you got here
Every cloud gives you logging for free, in the sense that there is nothing to install. A container on EKS writes to stdout and, with one add-on, the lines appear in CloudWatch. On GKE the agent is already in the node image. On AKS you tick "Container Insights". It is the path of least resistance, and on the first cloud it is genuinely the right call: you get something working in an afternoon and move on to the product.
The hidden cost shows up in three moments. The second cloud, when you discover that nothing you built on the first one transfers: not the queries, not the dashboards, not the alerts, not the muscle memory. The migration, when a workload moves and its six months of history stay behind in a store you keep paying for. And the ingestion invoice, which grows with your traffic rather than with your engineering headcount and has a way of becoming the third-largest line on the bill before anyone notices.
| CloudWatch Logs | Cloud Logging | Azure Monitor Logs | |
|---|---|---|---|
| Query language | Logs Insights (own syntax) | Logging query language | KQL |
| Ingestion (list price) | $0.50 / GB | $0.50 / GiB, first 50 GiB free | $2.76 / GB Analytics tier, $0.65 / GB Basic tier |
| Retention | $0.03 / GB-month | 30 days included | 31 days included |
| Export | Subscription filter to Kinesis, Firehose or Lambda; batch export to S3 | Log sinks to Pub/Sub, Cloud Storage, BigQuery | Diagnostic settings to Event Hubs or Storage; Data Export |
Three services, three query languages, three pricing models and three different answers to "how do I get my logs out". None of them is bad. They're just not yours.
The principle: separate emitting from storing
The fix is a boundary. Split logging into three layers and give each one a contract the others don't get to break.
The application emits structured JSON with OpenTelemetry semantic conventions. It knows its own name, service.name, and the trace_id of the request it's handling. It does not know, and must not care, which cloud it runs in. No SDK for CloudWatch, no client library for Cloud Logging. Stdout, or OTLP to localhost, and nothing else.
The agent runs one per host or cluster: an OpenTelemetry Collector or Grafana Alloy. This is the single component allowed to know about the cloud. It discovers cloud.provider, cloud.region and the cluster name from the metadata endpoint, stamps them onto every record, batches, compresses and ships. If you change clouds, this is the only thing that changes, and as we'll see below it doesn't even change much.
The backend is neutral: Loki for storage, Grafana on top. It speaks OTLP in and LogQL out. It has no idea whether a log line came from Virginia, Frankfurt or a laptop.
The contract between layers is OTLP and a handful of resource attributes. That's it. Any of the three layers can be swapped without the other two noticing.
The concrete example: one service, three clusters
The same api service runs on EKS, GKE and AKS. Below is the collector configuration deployed to all three as a DaemonSet. It is one file. There is no if cloud == aws anywhere in it.
# otel-collector.yaml — identical on EKS, GKE and AKS
receivers:
  otlp:
    protocols:
      grpc: { endpoint: 0.0.0.0:4317 }
      http: { endpoint: 0.0.0.0:4318 }
  filelog:
    include: [/var/log/pods/*/*/*.log]
    operators:
      - type: container          # parses CRI-O / containerd / docker line formats

processors:
  resourcedetection:
    detectors: [env, eks, gcp, aks, azure, ec2, system]
    timeout: 5s
    override: false              # never overwrite what the app already set
  k8sattributes:
    extract:
      metadata: [k8s.namespace.name, k8s.deployment.name, k8s.pod.name]
  batch:
    timeout: 5s
    send_batch_size: 4096

exporters:
  otlphttp/loki:
    endpoint: https://loki.observability.internal/otlp
    compression: zstd
    headers:
      X-Scope-OrgID: platform

service:
  pipelines:
    logs:
      receivers: [otlp, filelog]
      processors: [resourcedetection, k8sattributes, batch]
      exporters: [otlphttp/loki]
The interesting line is detectors. The collector tries each detector in order; the ones that don't apply fail quietly. On EKS the eks detector sets cloud.provider=aws, cloud.platform=aws_eks and the cluster name. On GKE the gcp detector sets cloud.provider=gcp, cloud.platform=gcp_kubernetes_engine and cloud.region. On AKS the aks detector sets cloud.provider=azure and cloud.platform=azure_aks. The application never touched any of these values. Same image, same manifest, three different answers, all correct.
On the receiving side, Loki 3 ingests OTLP natively and turns resource attributes into either index labels or structured metadata. By default service.name, k8s.namespace.name and cloud.region become labels. We add cloud.provider to that list, because "which cloud" is the first thing we group by during an incident:
# loki.yaml (excerpt)
limits_config:
  otlp_config:
    resource_attributes:
      attributes_config:
        - action: index_label
          attributes: [cloud.provider, cloud.platform]
Everything else the collector attached, like the pod name or the deployment, lands in structured metadata: queryable, but not indexed, so label cardinality stays flat.
Now the queries. All errors from the api service, across all three clouds, in one line:
{service_name="api"} |= "error"
The same, on GCP only:
{service_name="api", cloud_provider="gcp"} |= "error"
Error rate per cloud over the last five minutes, which is the panel you actually want on the incident dashboard:
sum by (cloud_provider) (
  rate({service_name="api"} | json | level="error" [5m])
)
And the query we were doing by eye at 02:40, following a single request across all three clusters:
{service_name=~"api|order-worker|billing"} | json | trace_id="4bf92f3577b34da6a3ce929d0e0e4736"
What Grafana returns for the last one, condensed:
2026-09-03 02:41:07.113  cloud_provider=aws    service_name=api           POST /orders 202                       trace_id=4bf9…4736
2026-09-03 02:41:07.201  cloud_provider=gcp    service_name=order-worker  enrich start order_id=88231            trace_id=4bf9…4736
2026-09-03 02:41:09.870  cloud_provider=gcp    service_name=order-worker  level=error upstream timeout billing   trace_id=4bf9…4736
2026-09-03 02:41:09.871  cloud_provider=azure  service_name=billing       level=error connection reset by peer   trace_id=4bf9…4736
Four lines, three clouds, one timestamp format, one timezone, sorted. The billing service on AKS is resetting connections and the worker on GKE is timing out because of it. That took eleven seconds to find instead of forty minutes, and nothing about the application changed to make it possible.
For local development and for a first try, this is the whole backend:
# docker-compose.yml — Loki + Grafana, OTLP in on :3100/otlp
services:
  loki:
    image: grafana/loki:3.5
    command: -config.file=/etc/loki/loki.yaml
    ports: ["3100:3100"]
    volumes:
      - ./loki.yaml:/etc/loki/loki.yaml:ro
      - loki-data:/loki

  grafana:
    image: grafana/grafana:12.1
    ports: ["3000:3000"]
    environment:
      GF_AUTH_ANONYMOUS_ENABLED: "true"
      GF_AUTH_ANONYMOUS_ORG_ROLE: Admin
    volumes:
      - ./grafana-datasource.yaml:/etc/grafana/provisioning/datasources/loki.yaml:ro
    depends_on: [loki]

volumes:
  loki-data: {}
Point the collector's exporter at http://localhost:3100/otlp, open Grafana on port 3000, and the queries above work unchanged. That's the point: the developer's laptop is just another value of cloud_provider.
The real objection: egress
Someone will raise it in the design review, and they'll be right: logs leaving a cloud cost money. Every provider charges for bytes going out to the internet or to another provider, roughly $0.09 to $0.12 per GB. At 100 GB a day of raw logs that's up to $360 a month per cloud, and it feels like paying to leave.
There are three honest answers, each with a trade-off.
Compress and sample at the agent. JSON logs compress five to ten times with zstd, and the collector does it before anything crosses the wire. Add a sampling policy that keeps all errors, all lines carrying a sampled trace, and one in ten of the debug lines, and your 100 GB becomes 10 to 20 GB. Egress drops to $15–40 a month. The trade-off is that you no longer have every line, and you have to decide up front which ones you don't need. For most teams this is the right answer and the only one they ever need.
Loki per cloud, federated Grafana. Run a small Loki in each cloud, writing to that cloud's object storage, and add each one as a data source in a single Grafana. A mixed-data-source panel queries all three and merges the result. Egress is zero: only query results leave, and those are kilobytes. The trade-off is three Loki deployments to operate, and cross-cloud queries are a merge in Grafana rather than a single index, so "sort everything by time" works but "join on trace_id across clouds" is slower. Choose this when data-residency rules keep logs in region anyway.
Centralise on the dominant cloud. If 80 % of your workloads are on AWS, put Loki there and pay egress on the 20 %. One index, one store, one query path, the simplest to run. The trade-off is that it's the most expensive option and it quietly makes one cloud more equal than the others, which is what you were trying to avoid.
For 100 GB a day split evenly across the three clouds, the egress bill for the three options, at list price and without commitments:
| Option | Bytes leaving per month | Egress cost |
|---|---|---|
| Raw, centralised | ~2 TB (two of three clouds) | ~$180–240 |
| Compressed and sampled, centralised | ~200–400 GB | ~$20–45 |
| Loki per cloud, federated queries | query results only | ~$0 |
What stays native, and that's fine
This article is about application logs. Your cloud also produces control-plane logs: CloudTrail, VPC Flow Logs, Azure Activity Log, GCP Audit Logs. Leave those where they are. They're generated by the platform, they're most useful with the platform's own tooling (GuardDuty, Defender, Security Command Center), and moving them buys you nothing unless an auditor demands a single archive. If that day comes, export them with a sink or a subscription filter into the same object storage and query them from Grafana too. Until then, it's a distraction.
The line is simple: if your code emitted it, it goes through the collector and it doesn't know about the cloud. If the cloud emitted it, the cloud can keep it.
The cost
The numbers that make the argument. Assumptions: 100 GB a day, 30-day retention, list prices in September 2026, no enterprise discounts, roughly 3 TB ingested per month.
| Backend | Ingestion | Retention (30 days) | Monthly total |
|---|---|---|---|
| CloudWatch Logs, Standard class | $1,500 | ~$90 | ~$1,600 plus $0.005 / GB scanned by queries |
| Google Cloud Logging | ~$1,475 (50 GiB free) | included | ~$1,475 |
| Azure Monitor, Analytics tier | $8,280 | included (31 days) | ~$8,300 |
| Azure Monitor, Basic tier | $1,950 | included | ~$1,950, with a restricted KQL |
| Loki on object storage, 3 nodes | $0 | ~$10–15 (300–400 GB compressed) | ~$350–500 compute and storage |
Loki's line is dominated by the three instances that run it, and those don't grow with your log volume until you're well past a terabyte a day. The managed services' lines grow linearly with every byte. At 10 GB a day the difference is a rounding error and you should take the native option and get on with your product. At 100 GB a day it pays for an engineer. At a terabyte a day it pays for the team.
One asterisk: you're now operating Loki. That's a real cost, in hours, not on this table. It's a small one, Loki is a single binary that reads and writes object storage, but it isn't zero, and if nobody on the team wants to own it, Grafana Cloud's hosted Loki sits between the two columns in price and takes the operations away.
Alternatives, briefly
Loki isn't the only neutral backend, and the architecture doesn't care which one you pick as long as it ingests OTLP.
VictoriaLogs is lighter than Loki, has no cardinality anxiety, and its query language is simpler. Pick it if you have a small team and a lot of high-cardinality fields like user IDs. OpenSearch gives you true full-text search and a huge ecosystem, at the price of running a cluster that cares about heap and shards. Pick it if your searches are actually text searches, not label lookups. SigNoz bundles logs, traces and metrics in one ClickHouse-backed product with its own UI. Pick it if you want one thing to install and don't already have Grafana.
Whichever you pick, the collector config above doesn't change. Only the exporter endpoint does.
Conclusion
Logs that don't know where they run are logs that survive the next infrastructure decision. Move a service from EKS to GKE and its history doesn't stay behind. Add a fourth cloud, or a bare-metal cluster at a client's site, and it appears as a new value of cloud_provider in a query you already have. Renegotiate with a vendor without your observability being a hostage in the conversation.
We didn't arrive at this from a slide deck. Our Agent Factory runs AI agents inside clients' environments, and clients have the clouds they have. One is all-in on AWS, one is on Azure because of a Microsoft agreement, one runs on-premises Kubernetes and won't let telemetry leave the building. If the platform's logs depended on the platform's cloud, we'd be maintaining three observability stacks and correlating by eye at 02:40. Instead every agent emits OTLP, a collector per cluster stamps the cloud onto it, and we have one query for "show me every failing agent run in the last hour" that works everywhere.
The cloud is an infrastructure detail. Treat it as one. If you'd like help drawing this boundary in your own stack, talk to us.