Big companies have on-call rotations, incident commanders, severity matrices and a tooling budget to match. A team of three has a group chat and whoever's awake. That team still has incidents, and they still happen at 02:40, and the question isn't whether to have a process, it's how little process captures most of the value. This is what we wrote down for a three-person team running a payments platform, what we read during an incident, and what we write afterwards. The whole thing fits on two pages, on purpose.
What we decide before, so we don't decide it at 02:40
The worst incident decisions are the ones made under pressure by someone who's just been woken up. So the small number of decisions that matter are made in advance and written where the alert links to them.
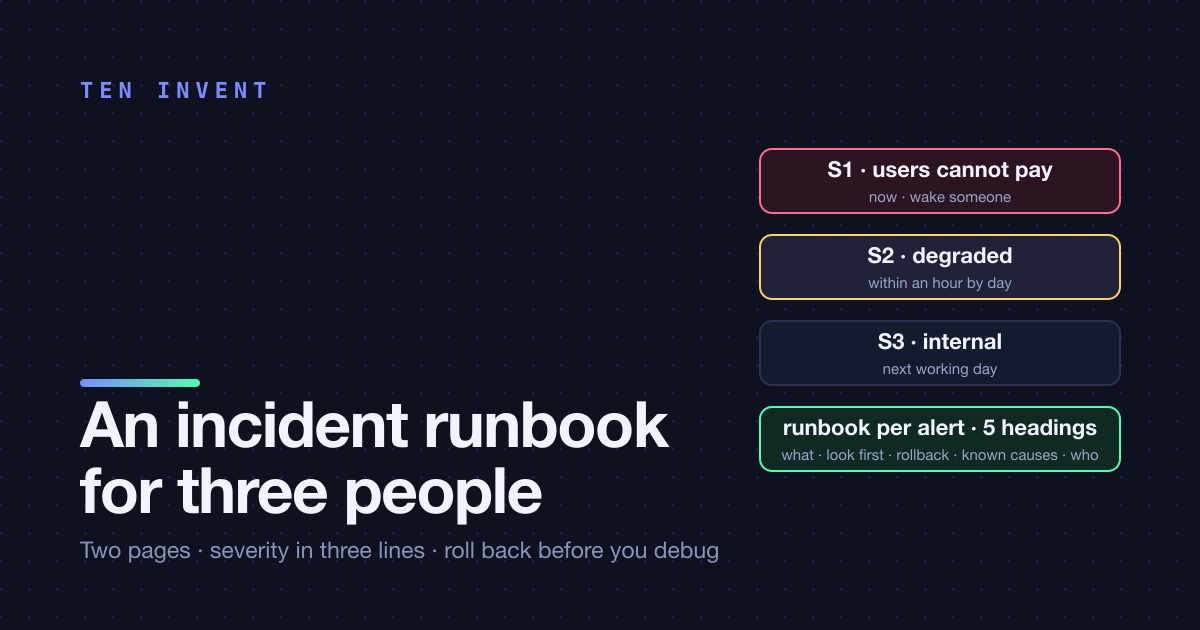
Severity, in three lines.
| Level | Definition | Response |
|---|---|---|
| S1 | Users can't do the thing they pay for: checkout fails, login fails, data is wrong | Now. Whoever sees it acts. Wake someone if needed. |
| S2 | Degraded: slow, a feature broken, errors for some users | Within an hour during the day, next morning at night |
| S3 | Internal: a job failed, a dashboard is wrong, a non-user-facing thing | Next working day |
The point of the table isn't precision. It's that "is this an S1?" has a one-line answer, and the answer decides whether to phone someone.
Who's first responder this week. Not a rotation with tooling; a name in the channel topic, changed on Monday. That person keeps the phone on and looks first. Everyone else is second. It's best-effort, and we say so, and it has never once been a problem, because the alternative, nobody being sure who's looking, is worse than any imperfect answer.
The first rule: roll back before you debug. If a deploy happened in the last few hours and the symptom started after it, the rollback is a tag change and takes four minutes. Do that first. Debugging happens afterwards, on staging, with the incident over. The number of times rolling back was the wrong call: zero. The number of times debugging first cost an extra hour of outage: three, all before we wrote the rule down.
The runbook page per alert
Every alert that can page links to a page, and every page has the same five headings. Here's the real one for the error-rate alert, lightly redacted.
Five headings. What it means is one sentence, because the alert name is never enough at 02:40. Look first is exactly three things, each a link or a command, in the order that finds the cause fastest; more than three and people skip the list. Rollback is the exact command and the condition for using it. Known causes is the accumulated memory of the team: every past incident on this alert, with what fixed it, one line each. Who to tell is the channel and the status page.
The Known causes section is the one that grows and the one that pays. Half of our incidents are repeats of something in that list, and for those, the time from page to fix is the time it takes to read the line.
What we read at 02:40
The alert. It has the runbook link in it, because the alert rule carries an annotation with the URL. Then the runbook page. Then the three Look first links, in order. That's it. There's no incident-commander role to assign and no bridge to open, because there are three of us and we're in the same chat.
What we deliberately don't read: the architecture docs, the cloud console's service health page, the last month of commits. If the three links don't find it and there was a deploy, roll back. If there was no deploy, the fourth step is the trace: find one failing request and open its trace, which usually points at the service that's actually broken rather than the one that's reporting errors.
Communication, with templates
Two audiences, two templates, both written in advance so nobody composes prose during an outage.
Internal, in #incidents, within five minutes of acknowledging:
S1 · api errors ~3 % since 02:31 · looking · last deploy 21:40 yesterday · rolling back first
One line. Severity, symptom, since when, what you're doing. Update the line every fifteen minutes, or when something changes, even if the update is "still looking". Silence is the thing people can't tolerate.
External, on the status page, for S1 only:
We're seeing elevated errors on checkout since 02:31 UTC. We've identified the cause and are rolling out a fix. Next update in 30 minutes.
The status page is a static HTML file in an S3 bucket behind CloudFront, on a separate domain, with a script that flips it between "operational", "degraded" and "outage" and appends a message. It costs nothing, it doesn't depend on anything that could be part of the incident, and it takes one command to update. A hosted status page product is fine too; the important properties are that it's outside the blast radius and that updating it takes seconds.
What we write afterwards
One page, within two working days, blameless by construction because it has three questions and none of them is "who":
- What happened, as a timeline. Alert at 02:31, acknowledged 02:34, rolled back 02:41, error rate normal 02:45, root cause identified 10:20 the next day. Times from the channel, not from memory.
- Why it happened, and why it wasn't caught earlier. The second half is the useful one. "The migration locked the table" is the cause; "we don't time migrations against a staging snapshot" is the gap.
- What we change. At most three items, each with an owner and a week. The most common item, by far, is a new line in a runbook's Known causes. The second most common is a new alert. The third is a change to a checklist.
The post-incident note goes in the repo, next to the runbooks, in a folder with the date. Eighteen months in, there are fourteen of them, and reading them in order is the best onboarding document we have.
What we don't do, and why it's fine
No formal on-call with escalation policies: three people, one phone that's on, best effort, stated plainly. No incident commander: the first responder is it, and if it's big they say so and someone else joins. No severity beyond three levels. No war room. No blameless-postmortem meeting; the note is enough, and it's discussed in the next regular sync.
All of that is the right thing for a fifty-person engineering organisation. For three, it's ceremony, and ceremony at 02:40 is what makes people not report the S2 that would have been an S1 by morning.
The process fits on two pages: the severity table, the first-responder name, the rollback rule, the runbook template, the two message templates, the three post-incident questions. It took an afternoon to write and it has been read, in anger, fourteen times.
If you'd like the two pages as a starting point, adapted to your stack, we'll write them with you.